Skip to content
Quantil Documentation
Navigating the HDT User Interface
When you first log in to the HDT portal, menus and submenus appear in the left pane and the dashboard appears in the workspace to the right.
The default menu lists the HDT activities you can perform.
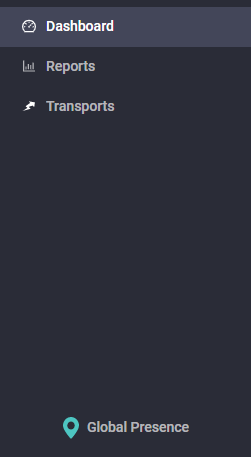
Dashboard
The Dashboard is the landing page after you log in to the HDT portal. It contains charts that show a snapshot of your account traffic over a recent period of time.
Reports
The Reports page allows you to view and generate reports about Bandwidth, Traffic Volume, and Requests with your specified filters.
Transports
The Transports page allows you to manage your transports.
Global Presence Page
The Global Presence page shows the worldwide locations of HDT PoPs and the status of the PoPs.